
Aortic Stenosis
Written By: Rosalyn Hesse MD, Edited by :Jeff Greco MD
Case
A 72 y/o male with hx of HTN is BIBEMS after a witnessed syncopal episode on the way to the doctor’s office. According to bystanders, patient was passed out for approximately 2 minutes before he regained consciousness. The patient states he felt completely fine up until the episode and denies any current symptoms. On exam you detect a loud systolic murmur. Your patient says something about having a “valve problem” and that he’s been told he might need surgery. You wonder to yourself if this patient possibly has aortic stenosis, so you pick up your US probe and take a look.
Assessing AS Severity
It’s safe to say that current trainees are relying more and more on US skills over their physical exam. In a loud chaotic emergency room, how many of us can identify a “crescendo-decrescendo” murmur? Using POCUS, there are many ways to look for signs of aortic stenosis.
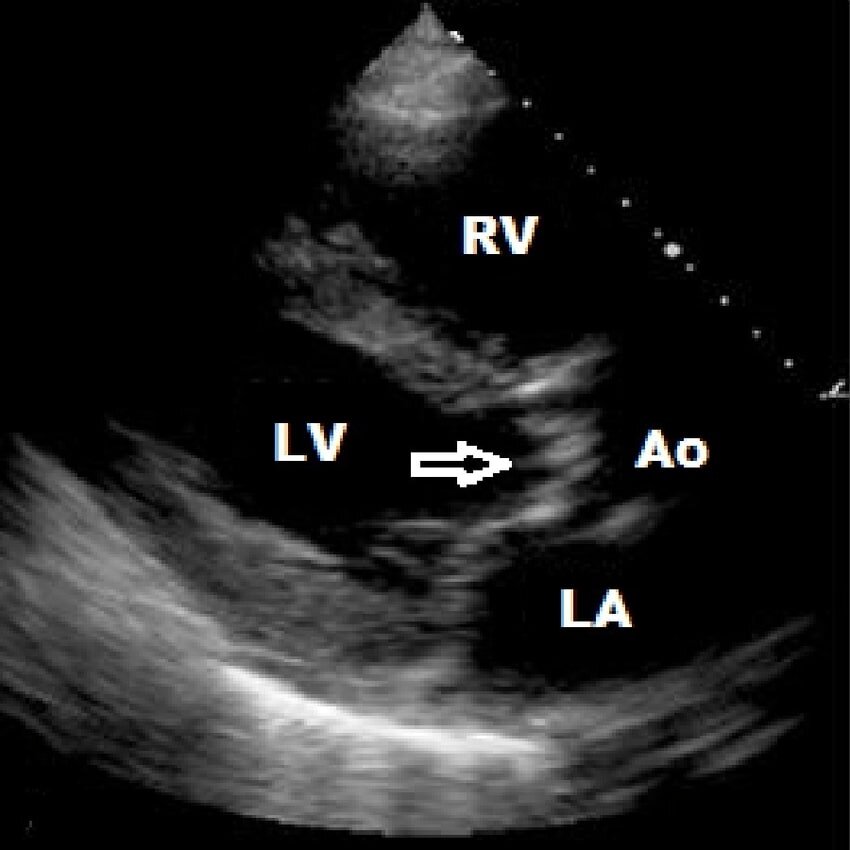
To begin, it is helpful to start with your traditional bedside echo views to look for secondary signs of long-standing aortic stenosis. Start with your parasternal long view of the heart and look for clues. The left ventricle will likely appear hypertrophied. Next, turn your attention to the LVOT and aortic valves. Normal aortic valves will be thin and mobile. Stenotic valves will appear hyperechoic due to calcification and will have reduced opening.
These aortic valve findings can be visualized in your parasternal short view at level of aortic valve and your apical 5 chamber view as well.
After you have gone through your 2D echo views, it’s time to take your measurements.
Use continuous wave doppler and place your marker at the aortic valve to generate a spectral doppler tracing envelope as seen below. Trace around one of the peaks as visualized below by the blue dotted line.


The machine will generate your AV max velocity as well as your transaortic gradient. There are measurement cutoffs to define mild, moderate, and severe AS which are listed below in the table.
From here, it’s possible to calculate AVA. You will need a few additional measurements including the LVOT VTI and LVOT diameter. The LVOT diameter can be measured in the parasternal long axis view. The LVOT VTI is measured with the heart in apical 5 chamber view with the pulse wave doppler placed just before the aortic valve in the LVOT. Trace around the generated peaks like done previously for the continuous wave doppler, and the machine will generate your LVOT VTI. The AVA is calculated by the equation shown in the image to the left.
Conclusion
The patient POCUS demonstrates a AV max velocity of 4.5 m/s, consistent with severe aortic stenosis. He is admitted for transcatheter aortic valve replacement and has a successful recovery.
References
1. http://www.emdocs.net/pocus-for-aortic-stenosis/
2. https://www.youtube.com/watch?v=RDPaeCqfA2Y
4. https://www.researchgate.net/figure/Diagnostic-criteria-for-degree-of-aortic-stenosis-severity-35_tbl4_235985358